Monday, May 4, 2015

GIS BLOG

A blog where my GIS knowledge, technical know-how, modelling real-world and analytics scenarios will be shared.  Here is the link to the blog:

http://gisgurukul.blogspot.in/

Geared up, Indeed

Follow-up, from my previous post.

By Grace of my Almighty God and Support of my Husband, my aspirations to earn the global certification was realized in Feb 2015.Oh! What can match the pride of being listed as 1 of the 10 Indians or 1 of the 552 in the World to be Certified in my Domain!!! Really, being a part of elite group of professionals is a humbling experience.

What i did realize, was that, the formula for success to clear Technical Certifications, is little to do with niche expertise using just a set of specified tools of an software. It's about knowing the software product capabilities in it's totality and application scenarios of utilizing them. I intend to write more specific details of preparing to clear Technical Certifications, on a separate thread of my GIS Blog.

Till then, let me fix my gaze of being listed as 1 of 10 Indians,  Now that's a sure moment of Pride i wanna freeze....

Spatial/Demographic Analysis: Graduated Color

Aim:
To create perform demographic analysis on Census 2011 data through ArcGis symbology tools and spatial join methods.

Procedure:

Step 1: Map Input
Census Data: Census or demographic data on which analysis will be performed.  For this session, The Census data of Tamilnadu for the year 2011 was taken.
Location feature: Shapefile of the location feature. For this session, shapefile of Tamilnadu, India was processed.

Step 2: Map Processing
  • ·         Perform a spatial join through a primary key id (Common ID) between the location shapefile and census dataset.  If the common ID is not present between data, create a FieldID and link the names of sub-features and districts of location and datasets, respectively. 
  • ·         Select an attribute, and calculate a preferred deduced value using field calculation. For this session Female illiteracy as a percentage Total illiterate population was taken.
  • ·         Using “Graduated Color” under quantities of symbology, display the female illiteracy percentage calculated. The number of classes, for display is scientifically computed as K = 3.3 Log N, where K is the number of classes and N is the total number of attributes in the location data set.  
  • ·         Method of classification can differ from the quality of data type. For this session, Natural Breaks (Jenks) was considered.
  • ·         Click “Ok” to generate the map output

Step 3: Map Display
Create Custom Map Layout with the necessary map elements and Export map to Jpeg format. 

Conclusion:

Demographic data is analyzed for female illiteracy rates and displayed using graduated colors in ArcGis 10.1.

Overlay Analysis: Polygon In Polygon

Aim:
To create perform overlay analysis of two (digitized) Line and Polygon Feature dataset.

Procedure:

Step 1: Map Input
Identify the two layers that can be digitized from your toposheet or base map. For this session, Forest Area and Road Network were digitized from the given topographic map of Nellore & Cuddapah Districts.  The Polygon Entities were saved into respective shapefiles in target ArcCatalog Folders.
 
Step 2: Map Processing
  • ·         Digitize the Polygon features for selected entities. Perform Attribute Editing. “Add Field” for “Name” and “Area”.  Specify the Names and calculate geometry to calculate shape area.  (note to calculate geometry, the features need to be on Projected coordinate system).
  • ·         Locate the “Intersect” in Analysis -> Overlay, toolbox.
  • ·         Add the Tool Inputs as “Forest” and update feature as “Waterbodies” and specify the target output folder.
  • ·         Click “Ok” to generate the map output.

Step 3: Map Display
Create Custom Map Layout with the necessary map elements and Export map to Jpeg format. One may also choose to Add Attribute table to layout, an option available within the Table options.

Conclusion:

Line in Polygon map for the chosen polygon attributes layers are generated using ArcGis 10.1.

Overlay Analysis: Line In Polygon

Aim:
To create perform overlay analysis of two (digitized) Line and Polygon Feature dataset.

Procedure:

Step 1: Map Input
Identify the two layers that can be digitized from your toposheet or base map. For this session, Forest Area and Road Network were digitized from the given topographic map of Nellore & Cuddapah Districts.  The Polygon Entities were saved into respective shapefiles in target ArcCatalog Folders. 

Step 2: Map Processing
  • ·         Digitize the Polygon features for selected entities. Perform Attribute Editing. “Add Field” for “Name” and “Area”.  Specify the Names and calculate geometry to calculate shape area.  (note to calculate geometry, the features need to be on Projected coordinate system).
  • ·         Locate the “Intersect” in Analysis -> Overlay, toolbox.
  • ·         Add the Tool Inputs as “Forest” and update feature as “Road” and specify the target output folder.
  • ·         Click “Ok” to generate the map output, of all Roads inside forest

Step 3: Map Display
Create Custom Map Layout with the necessary map elements and Export map to Jpeg format. One may also choose to Add Attribute table to layout, an option available within the Table options.

Conclusion:
Line in Polygon map for the chosen polygon attributes layers are generated using ArcGis 10.1.


Overlay Analysis: Point In Polygon

Aim:
To create perform overlay analysis of two (digitized) Point and Polygon Feature dataset.

Procedure:

Step 1: Map Input
Identify the two layers that can be digitized from your toposheet or base map. For this session, Forest Area and Settlements were digitized from the given topographic map of Nellore & Cuddapah Districts.  The Polygon Entities were saved into respective shapefiles in target ArcCatalog Folders. 

Step 2: Map Processing
  • ·         Digitize the Polygon features for selected entities. Perform Attribute Editing. “Add Field” for “Name” and “Area”.  Specify the Names and calculate geometry to calculate shape area.  (note to calculate geometry, the features need to be on Projected coordinate system).
  • ·         Locate the “Intersect” in Analysis -> Overlay, toolbox.
  • ·         Add the Tool Inputs as  “Forest” and update feature as “Settlements” and specify the target output folder.
  • ·         Click “Ok” to generate the map output, of all settlements inside forest

Step 3: Map Display
Create Custom Map Layout with the necessary map elements and Export map to Jpeg format. One may also choose to Add Attribute table to layout, an option available within the Table options.

Conclusion:

Point in Polygon map for the chosen polygon attributes layers are generated using ArcGis 10.1.

Overlay Analysis: Update

Aim:
To create perform overlay analysis of two (digitized) Feature datasets, using update method.

Procedure:

Concept:  Update works more or less like the append tool. The features (all or selected) of the source layer is updated to the target layer.

Step 1: Map Input
Identify the two layers that can be digitized from your toposheet or base map. For this session, Forest Area and Waterbodies (Perennial) were digitized from the given topographic map of Nellore & Cuddapah Districts.  The Polygon Entities were saved into respective shapefiles in target ArcCatalog Folders. 

Step 2: Map Processing
  • ·         Digitize the Polygon features for selected entities. Perform Attribute Editing. “Add Field” for “Name” and “Area”.  Specify the Names and calculate geometry to calculate shape area.  (note to calculate geometry, the features need to be on Projected coordinate system).
  • ·         Locate the “Update” in Analysis -> Overlay, toolbox.
  • ·         Define the Tool Input “Forest” and update feature as “Waterbodies” and specify the target output folder.
  • ·         Click “Ok” to generate the map output

Step 3: Map Display
Create Custom Map Layout with the necessary map elements and Export map to Jpeg format. It’s best to display map outputs in three data frames, one for the Overlay Output ad two for displaying the input feature classes.  One may also choose to Add Attribute table to layout, an option available within the Table options.

Conclusion:

Symmetrical Difference map for the chosen polygon attributes layers are generated using ArcGis 10.1.

Overlay Analysis: Symmetrical Difference

Aim:
To create perform overlay analysis of two (digitized) Feature datasets, using symmetrical difference method.

Procedure:

Concept:  Symmetrical Difference is the opposite of Intersect. All the non-common feature areas of two of more selected layers will be generated into a new output.

Step 1: Map Input
Identify the two layers that can be digitized from your toposheet or base map. For this session, Forest Area and Waterbodies (Perennial) were digitized from the given topographic map of Nellore & Cuddapah Districts.  The Polygon Entities were saved into respective shapefiles in target ArcCatalog Folders. 
Step 2: Map Processing
  • ·         Digitize the Polygon features for selected entities. Perform Attribute Editing. “Add Field” for “Name” and “Area”.  Specify the Names and calculate geometry to calculate shape area.  (note to calculate geometry, the features need to be on Projected coordinate system).
  • ·         Locate the “Symmetrical Difference” tool in Analysis -> Overlay, toolbox.
  • ·         Define the Tool Input “Forest” and SD layers feature as “Waterbodies” and specify the target output folder.
  • ·         Click “Ok” to generate the map output

Step 3: Map Display
Create Custom Map Layout with the necessary map elements and Export map to Jpeg format. It’s best to display map outputs in three data frames, one for the Overlay Output ad two for displaying the input feature classes.  One may also choose to Add Attribute table to layout, an option available within the Table options.

Conclusion:

Symmetrical Difference map for the chosen polygon attributes layers are generated using ArcGis 10.1.

Overlay Analysis: Union Map

Aim:
To create perform overlay analysis of two (digitized) Feature datasets, using  Union method.

Procedure:

Concept:  Unionis simple and straight. It’s a direct union or two or more selected layers.

Step 1: Map Input
Identify the two layers that can be digitized from your toposheet or base map. For this session, Forest Area and Waterbodies (Perennial) were digitized from the given topographic map of Nellore & Cuddapah Districts.  The Polygon Entities were saved into respective shapefiles in target ArcCatalog Folders. 

Step 2: Map Processing
  • ·         Digitize the Polygon features for selec
    ted entities. Perform Attribute Editing. “Add Field” for “Name” and “Area”.
      Specify the Names and calculate geometry to calculate shape area.  (note to calculate geometry, the features need to be on Projected coordinate system).
  • ·         Locate the “Union” tool in Analysis -> Overlay, toolbox.
  • ·         Define the Tool Input Tool Input “Forest” and union feature as “Waterbodies”  and specify the target output folder.
  • ·         Click “Ok” to generate the map output


Step 3: Map Display
Create Custom Map Layout with the necessary map elements and Export map to Jpeg format. It’s best to display map outputs in three data frames, one for the Overlay Output ad two for displaying the input feature classes.  One may also choose to Add Attribute table to layout, an option available within the Table options.
Conclusion:

Union map for the chosen polygon attributes layers are generated using ArcGis 10.1.

Overlay Analysis: Spatial Join Map

Aim:
To create perform overlay analysis of two (digitized) Feature datasets, using  Spatial Join method.

Procedure:

Concept:   Spatial Join is for geometrically similar or rather same shape features. The demographic datasets, for example is diverse, but for a same location or shapefile in ArcGis terms. Here, however, to illustrate the Overlay analysis using Spatial Join, tool, we will use the same two polygon feature class. This works more like intersect, retaining the water bodies only! Since that’s that only shape geometry that is same or identical to the common features of the two feature classes.

Step 1: Map Input
Identify the two layers that can be digitized from your toposheet or base map. For this session, Forest Area and Waterbodies (Perrinial) were digitized from the given topographic map of Nellore & Cuddapah Districts.  The Polygon Entities were saved into respective shapefiles in target ArcCatalog Folders. 

Step 2: Map Processing
  • ·         Digitize the Polygon features for selected entities. Perform Attribute Editing. “Add Field” for “Name” and “Area”.  Specify the Names and calculate geometry to calculate shape area.  (note to calculate geometry, the features need to be on Projected coordinate system).
  • ·         Locate the “Spatial Join” tool in Analysis -> Overlay, toolbox.
  • ·         Define the Tool Input “Forest” and join feature as “Waterbodies” and specify the target output folder. 
  • ·         Click “Ok” to generate the map output

Step 3: Map Display
Create Custom Map Layout with the necessary map elements and Export map to Jpeg format. It’s best to display map outputs in three data frames, one for the Overlay Output ad two for displaying th input feature classes.  One may also choose to Add Attribute table to layout, an option available within the Table options.

Conclusion:
Spatial Join map for the chosen polygon attributes layers are generated using ArcGis 10.1.


Overlay Analysis: Intersect Map

Aim:
To create perform overlay analysis of two (digitized) Feature datasets, using  intersect  method.

Procedure:

Concept:   Intersect tool performs a kind of overlay analysis, where common features, which intersects between,  the new dataset or Target layer and the another data set or layer,  will be retained.

Step 1: Map Input
Identify the two layers that can be digitized from your toposheet or base map. For this session, Forest Area and Waterbodies (Perennial) were digitized from the given topographic map of Nellore & Cuddapah Districts.  The Polygon Entities were saved into respective shapefiles in target ArcCatalog Folders. 

Step 2: Map Processing
  • ·         Digitize the Polygon features for Selected entities. Perform Attribute Editing. “Add Field” for “Name” and “Area”.  Specify the Names and calculate geometry to calculate shape area.  (note to calculate geometry, the features need to be on Projected coordinate system).
  • ·         Locate the “Intersect” tool in Analysis -> Overlay, toolbox.
  • ·         Define the Tool Input “Forest” and intersect update feature as “Waterbodies” and specify the target output folder.
  • ·         Click “Ok” to generate the map output

Step 3: Map Display
Create Custom Map Layout with the necessary map elements and Export map to Jpeg format. It’s best to display map outputs in three data frames, one for the Overlay Output ad two for displaying the input feature classes.  One may also choose to Add Attribute table to layout, an option available within the Table options.

Conclusion:

Intersect  map for the chosen polygon attributes layers are generated using ArcGis 10.1. 

Overlay Analysis: Identity Map

Aim:
To create perform overlay analysis of two (digitized) Feature datasets, using  identity method.

Procedure:

Concept:   Identity tool performs a kind of overlay analysis, where features in the new dataset or Target layer will wholly be retained, while selected features from the other layer (Old layer, usually), which overlap the new or target layer, will be retained.

Step 1: Map Input
Identify the two layers that can be digitized from your toposheet or base map. For this session, Forest Area and Waterbodies (Perennial) were digitized from the given topographic map of Nellore & Cuddapah Districts.  The Polygon Entities were saved into respective shapefiles in target ArcCatalog Folders.  

Step 2: Map Processing
  • ·         Digitize the Polygon features for Selected entities. Perform Attribute Editing. “Add Field” for “Name” and “Area”.  Specify the Names and calculate geometry to calculate shape area.  (note to calculate geometry, the features need to be on Projected coordinate system).
  • ·         Locate the “Identity” tool in Analysis -> Overlay, toolbox.
  • ·         Define the Tool Input “Forest” and identity layer as “waterbodies” and specify the target output folder.
  • ·         Click “Ok” to generate the map output


Step 3: Map Display
Create Custom Map Layout with the necessary map elements and Export map to Jpeg format. It’s best to display map outputs in three data frames, one for the Overlay Output ad two for displaying the input feature classes.  One may also choose to Add Attribute table to layout, an option available within the Table options.

Conclusion:
Identity map for the chosen polygon attributes layers are generated using ArcGis 10.1.


Thiessen Polygons: Point Entities

Aim:
To create a Thiessen Polygons for the given Map using the chosen Point attributes.

Procedure:

Concept:   Entities have area of Influence, which we can tag as “Service Areas” or “Sphere of Influence”. For Example, Post Offices that cater to particular zone, Places of religious worship that is accessible to the residents of a particular zone,…   Now, though these are completely two different entities, there could be instances where a particular feature types is repeated at a closer proximity within a zone.  Example, a section in the zone which has two temples. Now which temple would be more proximate to which part of the zonal section?  Another more obvious example will be habitats which have their own spatial areas of habitation, there is no physical or political boundary here, but just the sphere of influence, based on the distance between two or more entity features.  The non-uniform spread of features uses its own distance weighing attributes to compute Influential Zones of Polygons.

Step 1: Map Input
Identify the Point entities component for the location dataset. For this session, Post Offices and Temples (Hindu Place of Worship) were digitized from the given topographic map of Nellore & Cuddapah Districts.  The Point Entities were saved as “Civic Areas”.

Step 2: Map Processing
  • ·         Digitize the Point Entities for Selected entities. Perform Attribute Editing. “Add Field” for “Name” and “Weights”.  Specify the Name (Temples or PO) in the Attribute Window.
  • ·         Locate the “Create Thiessen Polygons” tool in Analysis -> Proximity, toolbox.
  • ·         Define the Tool Input “Civic Areas” and specify the target output folder.
  • ·         Click “Ok” to generate the map output

Step 3: Map Display
Create Custom Map Layout with the necessary map elements and Export map to Jpeg format

Conclusion:

Thiessian Polygon maps for the chosen polygon  attributes are generated using ArcGis 10.1. 

Variable-Ring Buffer Map: Point Entities

Aim:
To create a Variable-Ring Buffer Map using the chosen Point attributes.

Procedure:

Concept:   Entities cater specific, which we can tag as “Service Areas” or “Sphere of Influence”. For Example, Post Offices that cater to particular zone, Places of religious worship that is accessible to the residents of a particular zone,…   Now, these are completely two different entities, catering for completely two different purposes. So how do we show the buffer areas for entities of these types, where the buffer zones are specific to the character? The buffer value varies or is unique to the Feature type and this needs a map that calls for representing this Uniqueness. Variable Buffer is the Tool of solution

Step 1: Map Input
Identify the Point entities component for the location dataset. For this session, Post Offices and Temples (Hindu Place of Worship) were digitized from the given topographic map of Nellore & Cuddapah Districts.  The Point Entities were saved as “Civic Areas”.
Step 2: Map Processing
  • ·         Digitize the Point Entities for Selected entities. Perform Attribute Editing. “Add Field” for “Name” and “Weights”.  Specify the Name (Temples or PO) and Assign respective weights in the Attribute Window.
  • ·         Locate the Buffer tool in Analysis -> Proximity, toolbox.
  • ·         Define the Tool Input “Civic Areas” and now select the radial icon for “Field” choose “Weights” from the Drop Down. The Buffer will be computed for the Custom Quantity, here weights and generated as , map outputs
  • ·         Click “Ok” to generate the map output

Step 3: Map Display
Create Custom Map Layout with the necessary map elements and Export map to Jpeg format

Conclusion:

Variable -Ring Buffer maps for the chosen polygon attributes are generated using ArcGis 10.1. 

Multi-Ring Buffer Map: Polygon Entities

Aim:
To create a Multi-Ring Buffer Map using the chosen polygon attributes.

Procedure:

Step 1: Map Input
Identify the polygon component for the location dataset. For this session,  water bodies were digitized from the given topographic map of Nellore & Cuddapah Districts.

Step 2: Map Processing
  • ·         Locate the Multi-Ring Buffer tool in toolbox. In this session “Multi-Ring” tool in Proximity toolset was chosen.
  • ·         Define the Tool Input “Polygon” and  the linear Distances that will be computed as buffer distance (0.5, 1 and 2 Kilometers respectively) and specify the target output location
  • ·         Click “Ok” to generate the map output


Step 3: Map Display
Create Custom Map Layout with the necessary map elements and Export map to Jpeg format

Conclusion:

Multi-Ring Buffer maps for the chosen polygon  attributes are generated using ArcGis 10.1. 

Buffer Map: Spatial Entities

Aim:
To create a Buffer Map using the chosen point, Line and Polygon attributes.

Procedure:

Step 1: Map Input
Identify the point, Line and Polygon attribute component for the location dataset. For this session, the settlements were digitized from the given topographic map of Nellore & Cuddapah Districts.

Step 2: Map Processing
  • ·         Locate the Buffer tool in toolbox. In this session “Buffer (Analysis)” tool was chosen
  • ·         Define the Tool Input “Settlements”, “Road” and “Waterbodies” Features and  the linear Distances that will be computed as buffer distance (300 meters, 100 meters and 5 Kilometers respectively) and specify the target output location
  • ·         Click “Ok” to generate the map output


Step 3: Map Display
Create Custom Map Layout with the necessary map elements and Export map to Jpeg format

Conclusion:

Buffer maps for the chosen point, Line and Polygon attributes are generated using ArcGis 10.1. 

Buffer Map: Polygon

Aim:
To create a Buffer Map using the chosen polygon attributes.

Procedure:

Step 1: Map Input
Identify the polygon attribute component for the location dataset. For this session, the lakes (Perennial Waterbodies) were digitized from the given topographic map of Nellore & Cuddapah Districts.

Step 2: Map Processing

  • ·         Locate the Buffer tool in toolbox. In this session “Buffer (Analysis)” tool was chosen
  • ·         Define the Tool Input “Waterbodies” Feature in our case, the linear Distances that will be computed as buffer distance (5 Kms) and specify the target output location
  • ·         Click “Ok” to generate the map output


Step 3: Map Display                                   
Create Custom Map Layout with the necessary map elements and Export map to Jpeg format

Conclusion:

Buffer map for the chosen Polygon Entity is generated using ArcGis 10.1. 

Buffer Map: Point

Aim:
To create a Buffer Map using the chosen point attributes.

Procedure:

Step 1: Map Input
Identify the point attribute component for the location dataset. For this session, the settlements  were digitized from the given  topographic map of Nellore & Cuddapah Districts.

Step 2: Map Processing
  • ·         Locate the Buffer tool in toolbox. In this session “Buffer (Analysis)” tool was chosen
  • ·         Define the Tool Input “Settlements” Feature in our case, the linear Distances that will be computed as buffer distance (300 meters) and specify the target output location
  • ·         Click “Ok” to generate the map output


Step 3: Map Display
Create Custom Map Layout with the necessary map elements and Export map to Jpeg format

Conclusion:

Buffer map for the chosen Point Entity is generated using ArcGis 10.1. 

Topology Validation

Aim:
To create a Topology Network feature class and validate Topology for the given Map using the chosen Point attributes.

Procedure:

Concept:   Topology is the mathematical study of shapes and topological spaces. It is an area of mathematics concerned with the properties of space that are preserved under continuous deformations including stretching and bending, but not tearing or gluingEntities are geometries which are mostly digitized manually. Given the manual exercise of digitizing map for larger sections of an area, chances are that many of the features do not comply with the obvious logical or physical consistency of how it is supposed to be. Example, an junction point should have at least two roads polyines in its side or a coast should be along one side of an Area Polygon,…  Based on your feature geometry and kind of error-free relationship you want to establish, you have a choice to choose a or combination of rules from the 32 pre-defined rules. Same location of coordinates, boundaries, or nodes, chances which is suspected for any digitization errors can be detected and fixed through the methodology of geodatabase topology. The process can help you define a framework of spatial relationship among your feature datasets and overall to better manage your geographic data.   

Step 1: Map Input
Identify the entities component for the location dataset. For this session, Point (Settlements), Line (Roads) and Area (Water bodies) were all  digitized from the given topographic map of Nellore & Cuddapah Districts.  The line entity “Roads”, will be extensively validated in this session

Step 2: Map Processing
  • ·         Right-click the target feature-data set and click on “Topology” to create a new Topology Feature class. Customize the feature class with a Name, Feature Classes that will be involved, ranks (feature classes) and ultimately the Rules that will be the benchmark for validation.
  • ·         For this session,  “Line must not have dangles” rule was  chosen to validate smooth connection between the endpoint nodes of Road lines.
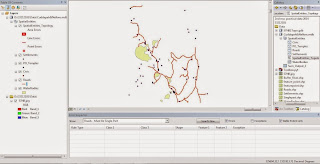
  • ·         Start Editing -> click on the “Error Inspector” under Topology tool bar to generate a summary of feature classes that do not comply with the chosen rule.
  • ·         On the error inspector window  click on the error, to understand the nature and scope of the error. Edit vertices or features to fix errors or mark as exception for those features you think is legitimate. This can be achvied by Right-clicking the error row in the window.
  • ·         Click “validate topology in current extent” tool to make sure your map is error free.


Step 3: Map Display

Take a snap screen of the error-inspector window, post topology validation.

Conclusion:
Topology validation for the chosen road polyline is performed using geo-database topology tools of ArcGis 10.1.

Geo-Database Creation (Personal)

Aim:

To create a Personal Geo-database, Feature dataset and feature class for the chosen spatial Entities.

Procedure:

Step 1: Map Input
Identify the point, line and Polygon Feature classes, created using previous digitization Exercises.

Step 2: Map Processing
·          In ArcCatalog, create a Personal Geodatabase in the target location, by right-click -> Personal Geodatabase. Customize a name for the database.
·         Right click the Geo-database created above and create a new feature dataset, by right-click -> Feature dataset.
·         Import the identified Feature Classes into feature dataset, by Right-Click ->  Import -> Feature Class (Multiple)

Step 3: Map Display
Export a Print Screen to Jpeg format

Conclusion:

Personal Geo-database, Feature dataset and feature class for the chosen spatial Entities is generated using ArcGis 10.1.